Tokens
This chart shows you your daily token usage across Text and Images.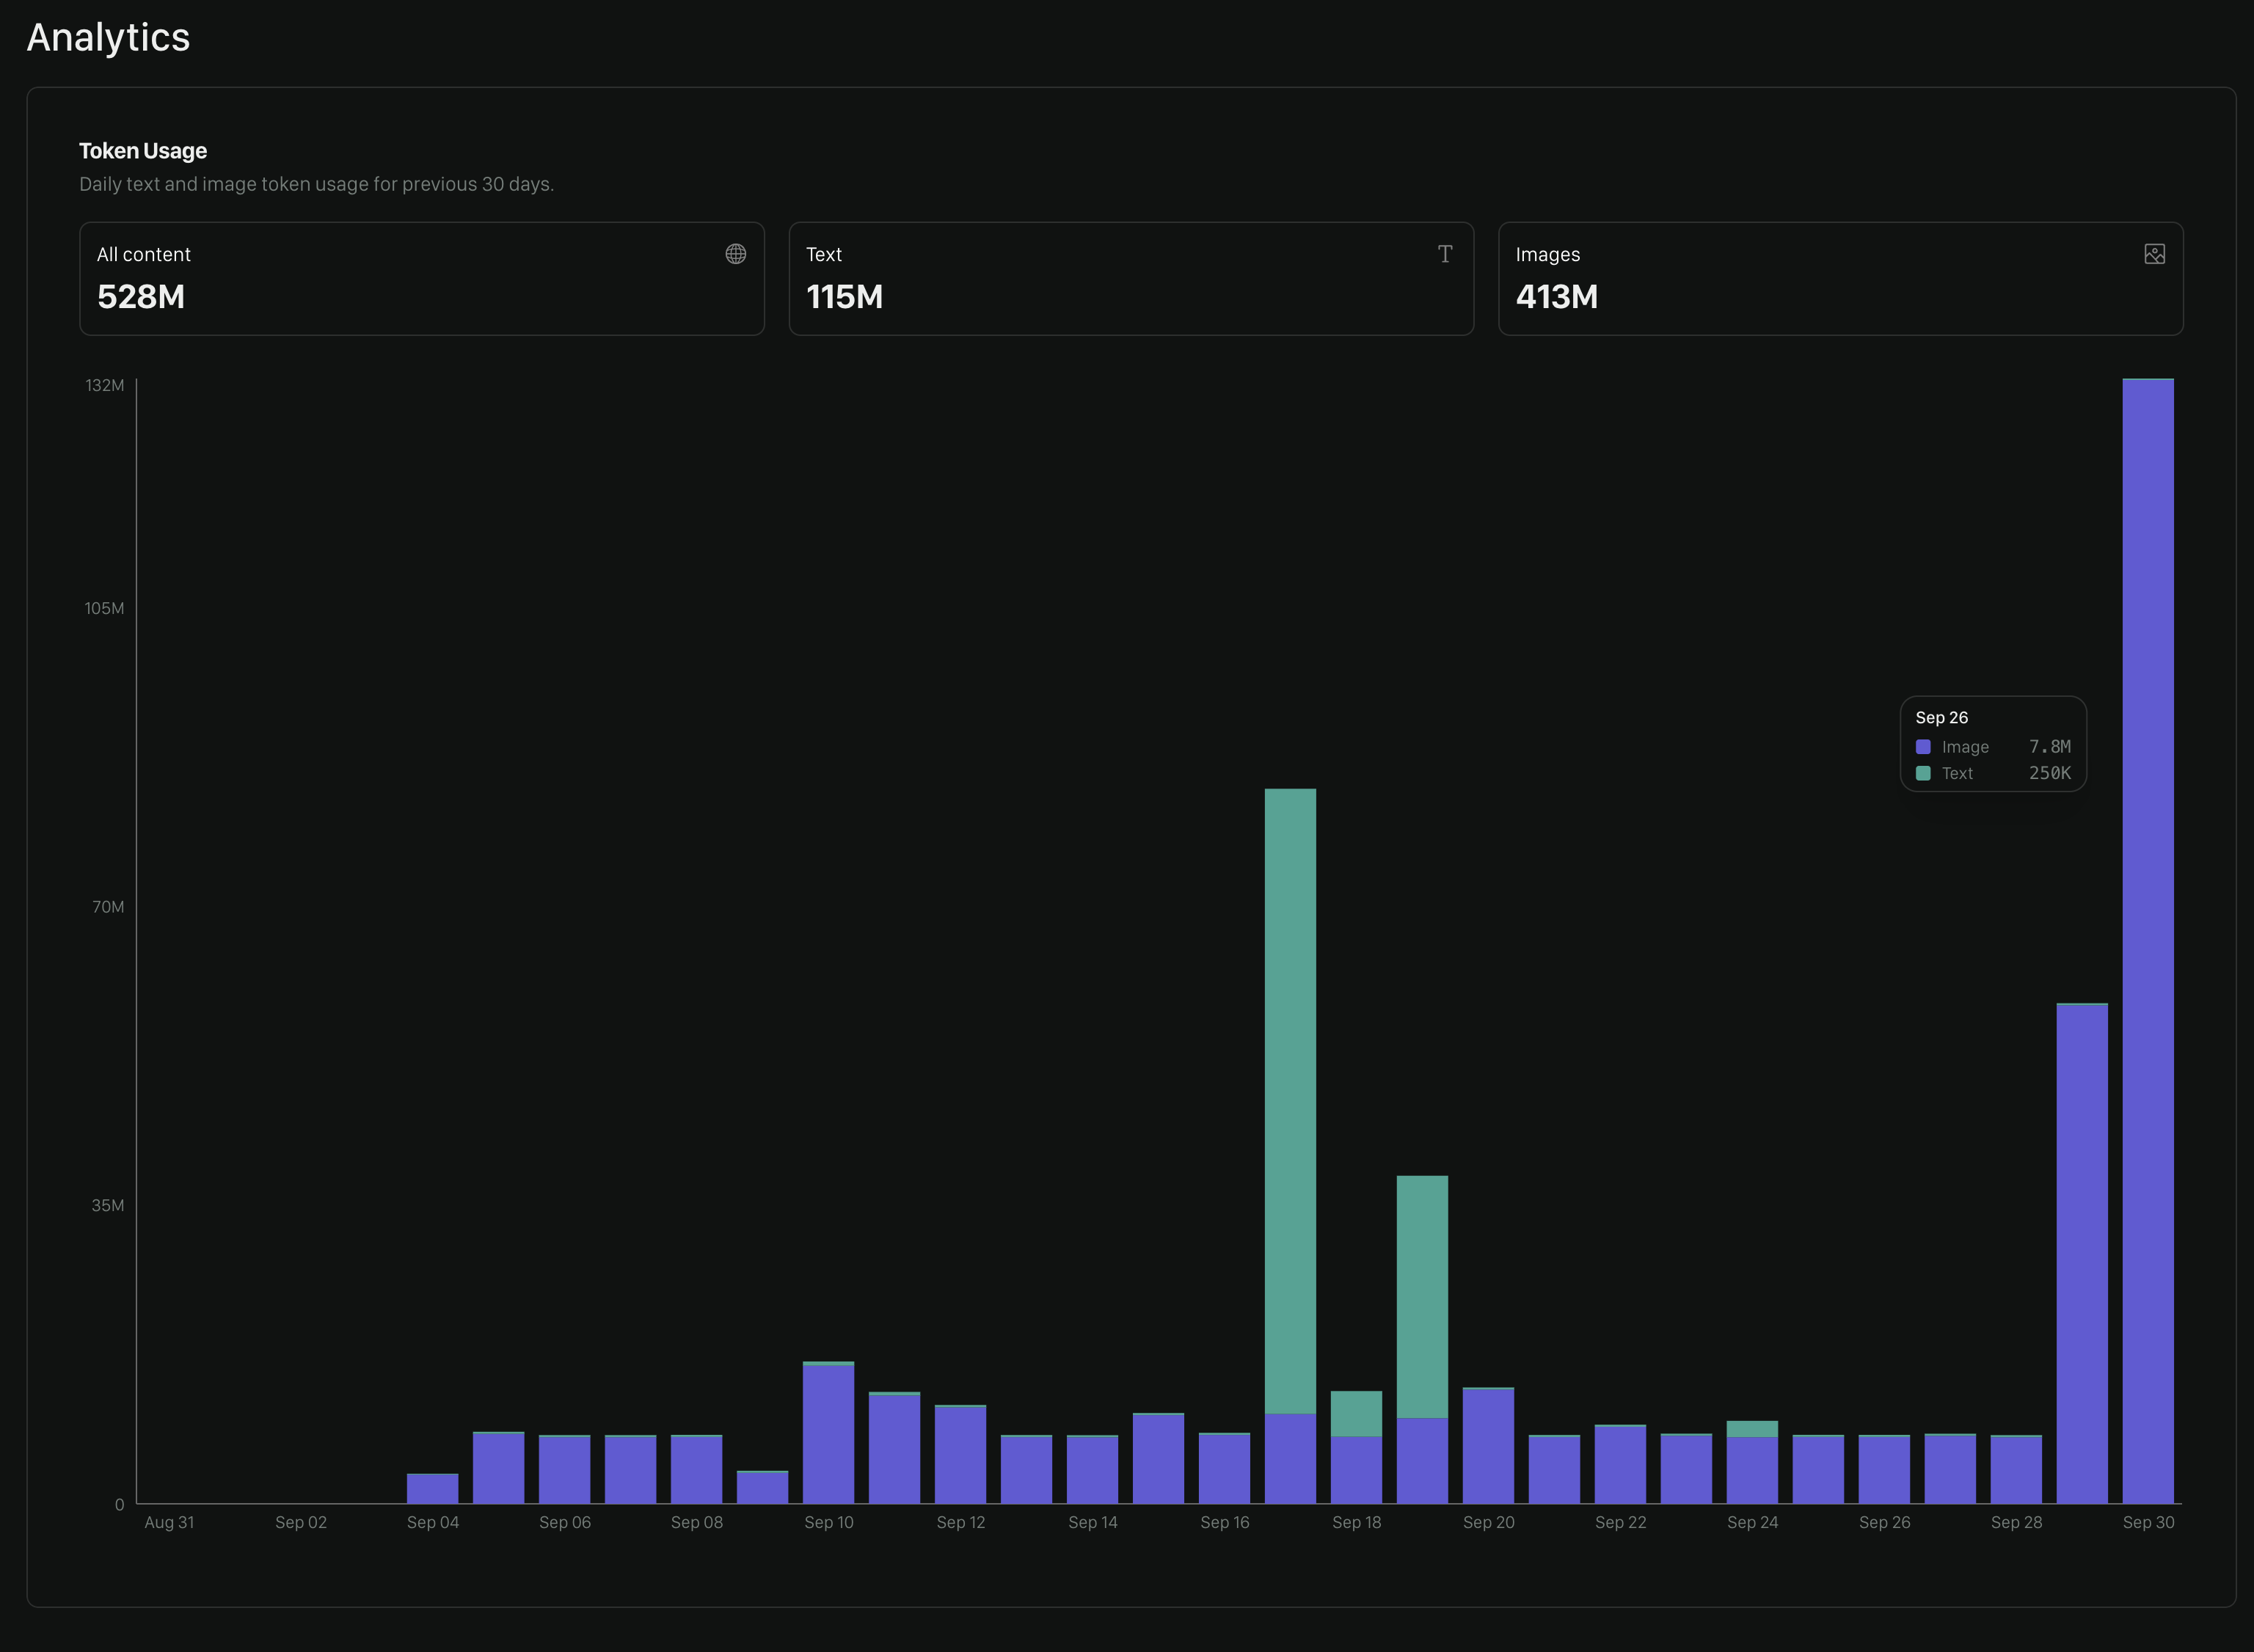
Policy Overview Table
Below the token usage chart, you’ll find a table showing your policy activity for a selected time period.- Total tokens — Total tokens used by the policy during the selected period.
- Text tokens — Tokens used for text-based evaluations.
- Image tokens — Tokens used for image-based evaluations.
- Total reviews — Number of evaluations performed using the policy.
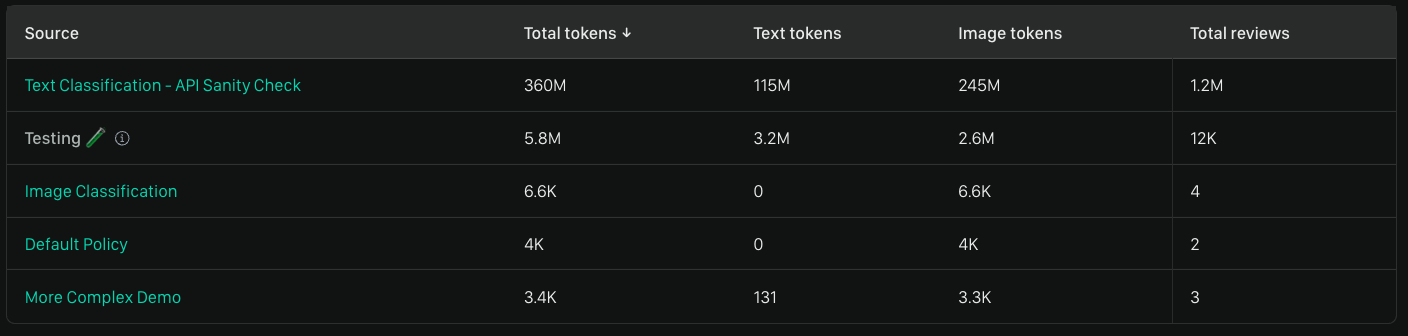
Testing shows how many tests you’ve run in the UI during the selected period across all policies (even those not listed here).
Reviews Remaining
If you’re an evaluator you’ll see a chart like the below showing you how many reviews you have before your review limit is up. You’ll need to contact your account owner to change this limit.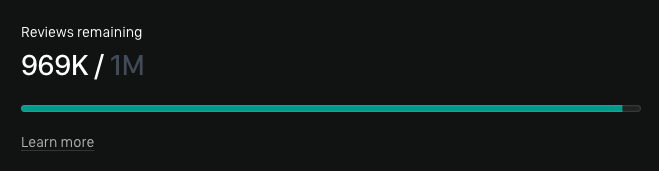
We’d Love to Hear From You
Whether you have a suggestion, feedback, or a bug to report, here are the best ways to get in touch:- In the App: Use the Feedback button for direct suggestions.
- On Slack: Reach out to the team in your shared channel.
- With your AM: Talk to your dedicated account manager.
- Via Email: Send a message to [email protected].