Insights
Here you can see basic metrics filtered to a specific policy over a given time period. This will help you see the version over version performance, how your label outcomes change over time or with volume spikes and more.Summary metrics
These metrics are calculated only from evaluations run against the selected policy within the selected time window.Total tokens used
- The total number of tokens processed for evaluations in the time window.
Reviews (API evaluations)
- The total number of evaluations executed against this policy in the time window.
- Each evaluation counts as one review.
True %
- The share of evaluations in the time window that returned True.
- At least one label was applied during that evaluation.
False %
- The share of evaluations in the time window that returned False.
- No labels were applied during that evaluation.
Daily label chart
The chart shows day-by-day label outcomes for the selected time window.What’s shown
For each day (UTC):- How often each label was True (i.e., applied at least once in an evaluation)
- The policy version associated with those outcomes
- If the policy version changed during the selected window, the chart reflects which version the label outcomes belonged to.
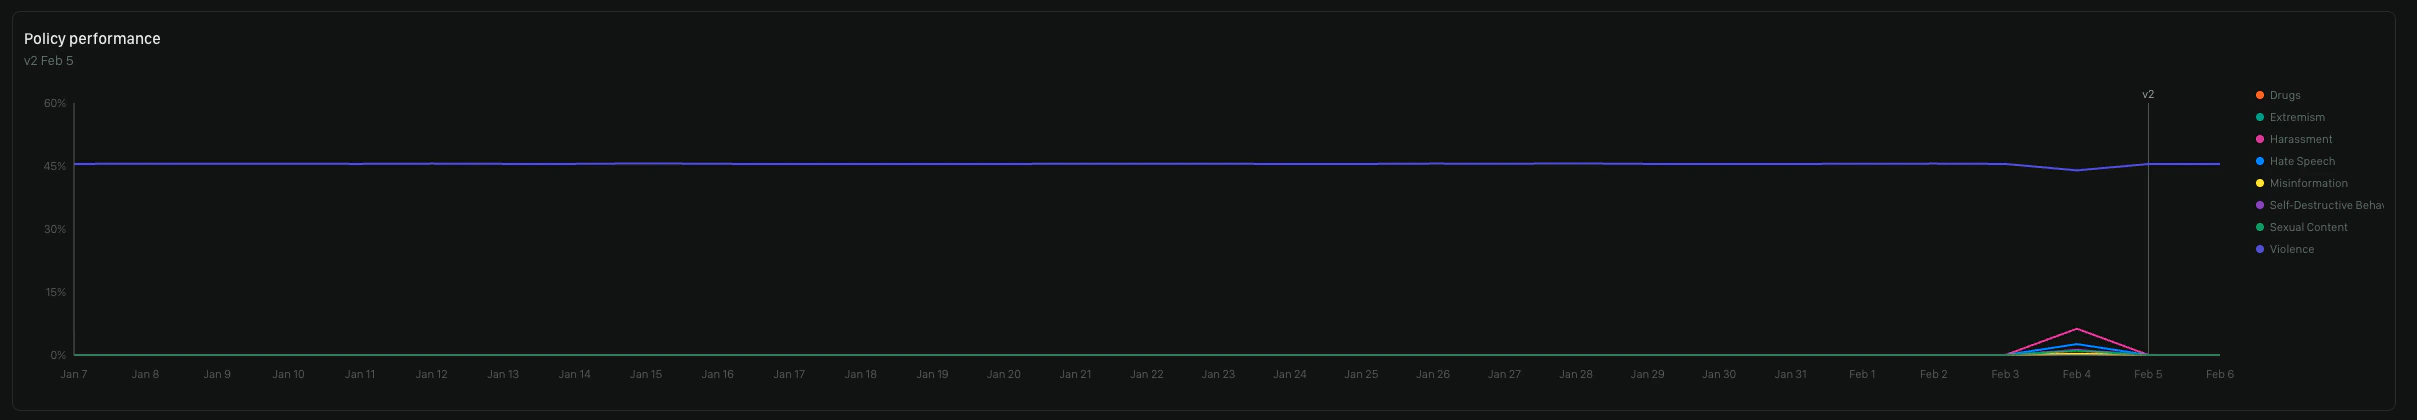
How to interpret it
- A higher count for a label means the label was applied more often that day.
- If you see a behavior shift aligned with a version change, use the version context to compare performance before/after the deployment.
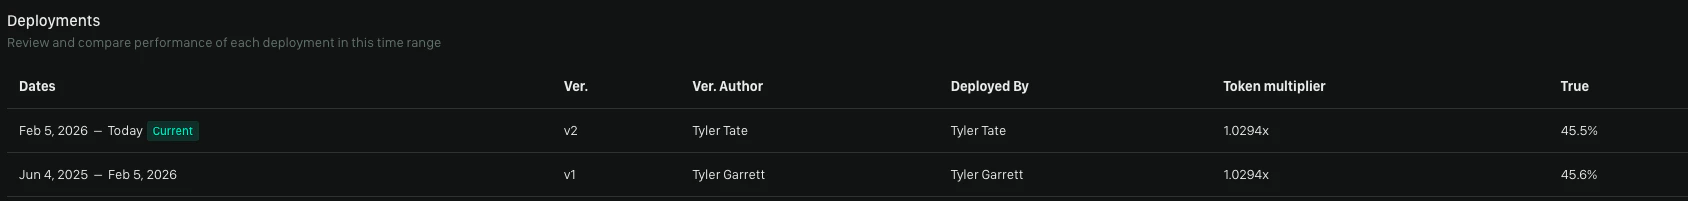
Deployment history
Deployment history lists policy deployments that occurred within the selected time window. Each deployment includes:- Dates: The time range when this policy version was used to evaluate content.
- Version: The policy version’s sequential identifier
- Version author: Who authored the policy content.
- Deployed by: Who made this version the active version used for policy evaluations.
- Token multiplier: Multiplier applied to policy evaluations that affects cost and reflects relative complexity.
- Current True %: Percentage of evaluations during this deployment where at least one label was applied.